

Overview
Section titled “Overview”The previous tutorial demonstrates how you can deploy and interact with Move contracts using various CLI commands.
By default, those commands send a transaction to the remote fullnode for simulation and execution. You can override this behavior and simulate the transaction locally, by appending one of the following command line options of your preference:
--local: Simulate the transaction locally without conducting any further measurements or analysis.--benchmark: Benchmark the transaction and report the running time(s).--profile-gas: Profile the transaction for detailed gas usage.
These additional options can be used in combination with the following CLI commands:
aptos move runaptos move run-scriptaptos move publish
Alternatively, if you are interested in replaying a past transaction, check out this tutorial.
Deploying the Example Contract
Section titled “Deploying the Example Contract”For demonstration purposes, we will continue to use the hello_blockchain package as an example.
First, publish the package to devnet or testnet (if you haven’t done so already).
Change into the package directory.
cd aptos-move/move-examples/hello_blockchainThen publish the package using the following command.
aptos move publish --named-addresses hello_blockchain=default --assume-yesOutput
{ "Result": { "transaction_hash": "0xe4ae0ec4ea3474b2123838885b04d7f4b046c174d14d7dc1c56916f2eb553bcf", "gas_used": 1118, "gas_unit_price": 100, "sender": "dbcbe741d003a7369d87ec8717afb5df425977106497052f96f4e236372f7dd5", "sequence_number": 5, "success": true, "timestamp_us": 1713914742422749, "version": 1033819503, "vm_status": "Executed successfully" }}Notice that you do need to have your CLI profile set up properly and bind the named addresses correctly. Please refer to CLI Configuration for more details.
Local Simulation
Section titled “Local Simulation”Next, execute the entry function message::set_message with local simulation enabled using the additional command line option --local. This will execute the transaction locally without conducting any further measurements or analysis.
aptos move run --function-id 'default::message::set_message' --args 'string:abc' --localOutput
Simulating transaction locally...{ "Result": { "transaction_hash": "0x5aab20980688185eed2c9a27bab624c84b8b8117241cd4a367ba2a012069f57b", "gas_used": 441, "gas_unit_price": 100, "sender": "dbcbe741d003a7369d87ec8717afb5df425977106497052f96f4e236372f7dd5", "success": true, "version": 1033887414, "vm_status": "status EXECUTED of type Execution" }}Benchmarking
Section titled “Benchmarking”To measure the running time(s) of your transaction, use the --benchmark option.
aptos move run --function-id 'default::message::set_message' --args 'string:abc' --benchmarkOutput
Benchmarking transaction locally...Running time (cold code cache): 985.141µsRunning time (warm code cache): 848.159µs{ "Result": { "transaction_hash": "0xa2fe548d37f12ee79df13e70fdd8212e37074c1b080b89b7d92e82550684ecdb", "gas_used": 441, "gas_unit_price": 100, "sender": "dbcbe741d003a7369d87ec8717afb5df425977106497052f96f4e236372f7dd5", "success": true, "version": 1033936831, "vm_status": "status EXECUTED of type Execution" }}It’s worth noting that these running times serve only as informational references, as they are contingent upon the specifications of your local machine and may be influenced by noise or other random factors.
If you are aiming to optimize your contract, you should base your decisions on the gas profiling results.
Gas Profiling
Section titled “Gas Profiling”The Aptos Gas Profiler is a powerful tool that can help you understand the gas usage of Aptos transactions. Once activated, it will simulate transactions using an instrumented VM, and generate a web-based report.
The gas profiler can also double as a debugger since the report also includes a full execution trace.
Using the Gas Profiler
Section titled “Using the Gas Profiler”The gas profiler can be invoked by appending the --profile-gas option.
aptos move run --function-id 'default::message::set_message' --args 'string:abc' --profile-gasOutput
Simulating transaction locally using the gas profiler...Gas report saved to gas-profiling/txn-d0bc3422-0xdbcb-message-set_message.{ "Result": { "transaction_hash": "0xd0bc342232f14a6a7d2d45251719aee45373bdb53f68403cfc6dc6062c74fa9e", "gas_used": 441, "gas_unit_price": 100, "sender": "dbcbe741d003a7369d87ec8717afb5df425977106497052f96f4e236372f7dd5", "success": true, "version": 1034003962, "vm_status": "status EXECUTED of type Execution" }}You can then find the generated gas report in the directory gas-profiling:
Directoryhello_blockchain/
- Move.toml
Directorysources/
- …
Directorygas-profiling/
Directorytxn-XXXXXXXX-0xXXXX-message-set_message/
Directoryassets/
- …
- index.html
index.html is the main page of the report, which can view using your web browser.
Sample report
Understanding the Gas Report
Section titled “Understanding the Gas Report”The gas report consists of three sections that help you to understand the gas usage through different lenses.
Flamegraphs
Section titled “Flamegraphs”The first section consists of visualization of the gas usage in the form of two flamegraphs: one for execution & IO, the other for storage. The reason why we need two graphs is that these are measured in different units: one in gas units, and the other in APT.
It is possible to interact with various elements in the graph. If you hover your cursor over an item, it will show you the precise cost and percentage.
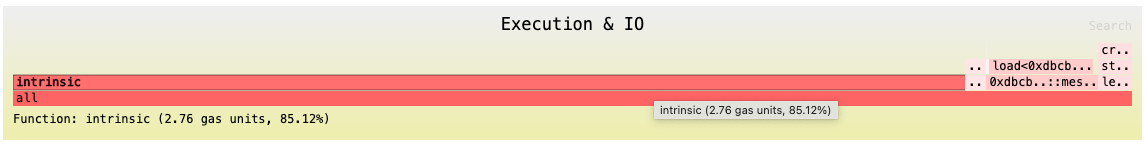
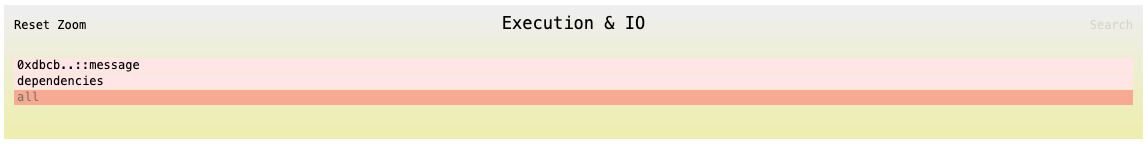
If you click on an item, you can zoom into it and see the child items more clearly.
You can reset the view by clicking the “Reset Zoom” button in the top-left corner.
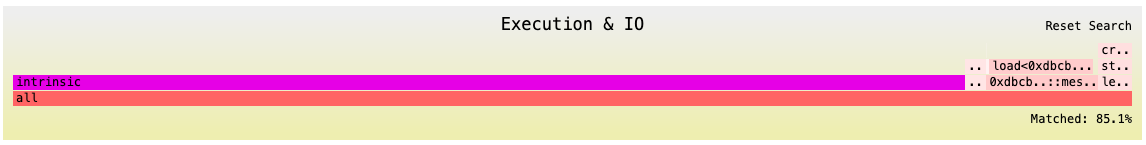
There is also “Search” button in the top-right corner that allows to match certain items and highlight them.
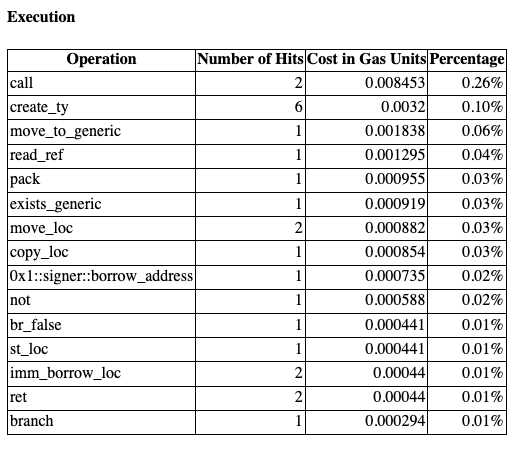
Cost Break-down
Section titled “Cost Break-down”The second section is a detailed break-down of all gas costs. Data presented in this section is categorized, aggregated and sorted. This can be especially helpful if you know what numbers to look at.
For example, the following tables show the execution costs of all Move bytecode instructions/operations. The percentage here is relative to the total cost of the belonging category (Exec + IO in this case).
Full Execution Trace
Section titled “Full Execution Trace”The final section of the gas report is the full execution trace of the transaction that looks like this:
intrinsic 2.76 85.12% dependencies 0.0607 1.87% 0xdbcb..::message 0.0607 1.87% 0xdbcb..::message::set_message 0.32416 10.00% create_ty 0.0004 0.01% create_ty 0.0004 0.01% create_ty 0.0004 0.01% create_ty 0.0004 0.01% create_ty 0.0008 0.02% imm_borrow_loc 0.00022 0.01% call 0.00441 0.14% 0x1::signer::address_of 0.007534 0.23% create_ty 0.0008 0.02% move_loc 0.000441 0.01% call 0.004043 0.12% 0x1::signer::borrow_address 0.000735 0.02% read_ref 0.001295 0.04% ret 0.00022 0.01% st_loc 0.000441 0.01% copy_loc 0.000854 0.03% load<0xdbcb..::0xdbcb..::message::MessageHolder> 0.302385 9.33% exists_generic 0.000919 0.03% not 0.000588 0.02% br_false 0.000441 0.01% imm_borrow_loc 0.00022 0.01% move_loc 0.000441 0.01% pack 0.000955 0.03% move_to_generic 0.001838 0.06% branch 0.000294 0.01% @28 ret 0.00022 0.01% ledger writes 0.097756 3.01% transaction events state write ops 0.097756 3.01% create<0xdbcb..::0xdbcb..::message::MessageHolder> 0.097756 3.01%The left column lists all Move instructions and operations being executed, with each level of indentation indicating a function call.
The middle column represents the gas costs associated with the operations.
There is also a special notation @number that represents a jump to a particular location in the byte code. (@28 in the snippet above)
This is purely informational and to help understand the control flow.